The Big Lie: A ‘Labor Shortage’!
Don’t Believe the Corporate “Labor Shortage” Bullsh*t What’s really happening is more accurately described as a living-wage shortage, a hazard pay shortage, a childcare shortage, a paid sick leave shortage, and a health care shortage.
In realality, unemployment over 2o% of workers have been unemployed since the 2008 cracsh,
Shadow Government Statistics Aleternate Unemplyments Chart October 2021 Alternate Unemployment is 25.1% The seasonally-adjusted SGS Alternate Unemployment Rate reflects current unemployment reporting methodology adjusted for SGS-estimated long-term discouraged workers, who were defined out of official existence in 1994. That estimate is added to the BLS estimate of U-6 unemployment, which includes short-term discouraged workers. The U-3 unemployment rate is the monthly headline number. The U-6 unemployment rate is the Bureau of Labor Statistics’ (BLS) broadest unemployment measure, including short-term discouraged and other marginally-attached workers as well as those forced to work part-time because they cannot find full-time employment.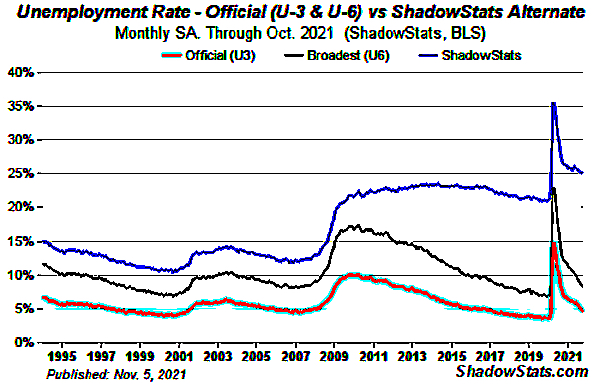 Most workers do not make a Living Wage! Real Wages have Fallen Since the Wage Price Freeze of 1972 (Shadow Government Statistics): Graph 3 plots the seasonally-adjusted earnings as officially deflated by the BLS (red-line), and as adjusted for the ShadowStats-Alternate CPI Measure, 1990-Base (blue-line). When inflation-depressing methodologies of the 1990s began to kick-in, the artificially-weakened CPI-W (also used in calculating Social Security cost-of-living adjustments) helped to prop up the reported real earnings. Official real earnings today still have not recovered their inflation-adjusted levels of the early-1970s, and, at best, have been in a minimal uptrend for the last two decades (albeit spiked recently by negative headline inflation). Deflated by the ShadowStats (1990-Based) measure, real earnings have been in fairly-regular decline for the last four decades, which is much closer to common experience than the pattern suggested by the CPI-W. See the Public Commentary on Inflation Measurement for further detail. (This process has led to a greater worker productivity and windfall profits for the capitalist, without more value being added to society.— RS)
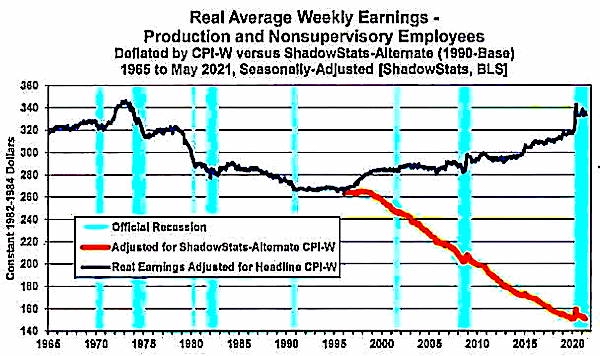 Most workers make less than $369 per week! A raise in the minimum wage to $15 per hour, whould be anincrease in waged for the majority of workers! Employed full time: Median usual weekly real earnings: Wage and salary workers: 16 years and over is $368!
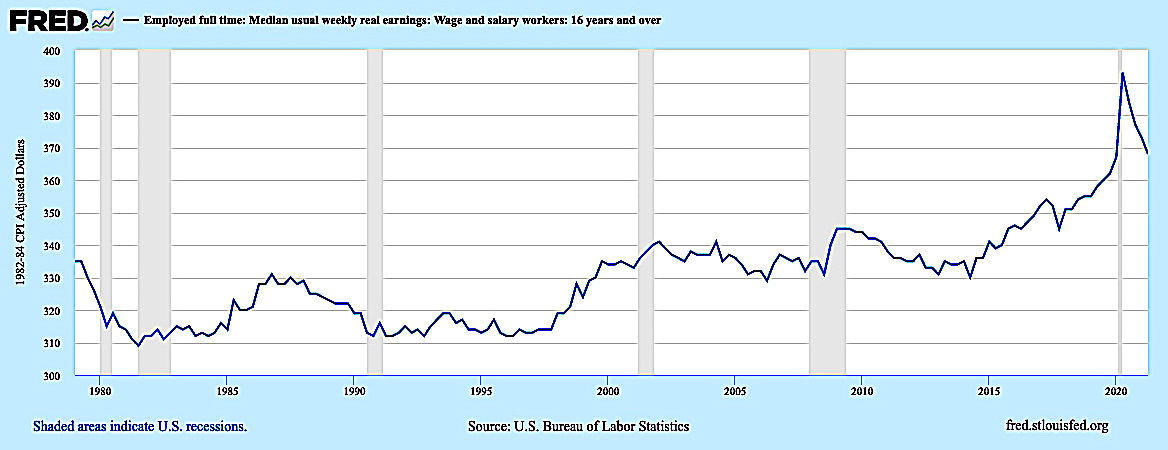 The Reality is that a living-wage shortage, a hazard pay shortage, a childcare shortage, a paid sick leave shortage, and a health care shortage jobs are in short supply.
The truth is workers cannot afford to go back to work in todays’ world!
So Don’t Believe the Corporate “Labor Shortage” Bullsh*t What’s really happening is more accurately described as a living-wage shortage, a hazard pay shortage, a childcare shortage, a paid sick leave shortage, and a health care shortage.
* * * *
I get most of my economic data from Shadow Government Statistics website written ny an honest economist — John Williams. I use mainly his charts to prove my arguments. Hed adjusts his satisrics to the changes in how the governent ‘figrures’ their statistics over the years. Renemberthe old slogan: Figures Don’ Lie, But Liars Can ‘Figure’! (See his short biology, from his website below.)
Walter J. “John” Williams was born in 1949. He received an A.B. in Economics, cum laude, from Dartmouth College in 1971, and was awarded a M.B.A. from Dartmouth’s Amos Tuck School of Business Administration in 1972, where he was named an Edward Tuck Scholar. During his career as a consulting economist, John has worked with individuals as well as Fortune 500 companies.
Although I am known formally as Walter J. Williams, my friends call me “John.” For 30 years, I have been a private consulting economist and, out of necessity, had to become a specialist in government economic reporting.
One of my early clients was a large manufacturer of commercial airplanes, who had developed an econometric model for predicting revenue passenger miles. The level of revenue passenger miles was their primary sales forecasting tool, and the model was heavily dependent on the GNP (now GDP) as reported by the Department of Commerce. Suddenly, their model stopped working, and they asked me if I could fix it. I realized the GNP numbers were faulty, corrected them for my client (official reporting was similarly revised a couple of years later) and the model worked again, at least for a while, until GNP methodological changes eventually made the underlying data worthless.
That began a lengthy process of exploring the history and nature of economic reporting and in interviewing key people involved in the process from the early days of government reporting through the present. For a number of years I conducted surveys among business economists as to the quality of government statistics (the vast majority thought it was pretty bad), and my results led to front page stories in 1989 in the New York Times and Investors Daily (now Investors Business Daily), considerable coverage in the broadcast media and a joint meeting with representatives of all the government’s statistical agencies.
Nonetheless, the quality of government reporting has deteriorated sharply in the last couple of decades. Reporting problems have included methodological changes to economic reporting that have pushed headline economic and inflation results out of the realm of real-world or common experience.
Over the decades, well in excess of 1,000 presentations have been given on the economic outlook, or on approaches to analyzing economic data, to clients—large and small—including talks with members of the business, banking, government, press, academic, brokerage and investment communities. I also haveprovided testimony before Congress
An old friend—the late-Doug Gillespie—asked me some years back to write a series of articles on the quality of government statistics. The response to those writings (the Primer Series available at the top-center of this page) was so strong that we started ShadowStats.com (Shadow Government Statistics) in 2004. The newsletter is published as part of my economic consulting services. — John Williams