The Real State of the Union:Daily Blog 2/25
The Real State of the Union:Daily Blog 2/25
I watched the States Of the Union Speah
Trump spent the first part of his speach lying about the states of the economy! That is nothing knew, for the real state of the economy has been misreprested by the goverment for decads!
The Real State of the Ecomony can be found below.
Trump Touts ‘Drill, Baby, Drill’ Agenda – But No Mention of Climate Crisis
Basically Trump spent a lot of time on ‘Ilegal Immigrants’ He made it very clear that ICE will contine the terrorism of the cities! And he will use force to ‘stop the steal’ during the 2016 Elections! It is also clear he will continue his Might is Right Policy on a world scale. He intends to use the military to invade other countries,to attempt to restablish a Pax Americana!
A Quick Look at the Sate of the Econmy:
Video: Trump’s 2026 SOTU Speech: Economic Obfuscation and Political Theater
Another way that the government doesn’t admit to how challenging things can be, like how median household incomes have lagged so far behind the cost of living for the last 40 years. — Forbes, Searching For The Real Unemployment Rate, Not Just The Official One
Treated very briefly in passing was the topic of jobs. Trump’s avoidance of the topic is understandable—given that this past year the US economy has created a total of only 181,000 jobs; i.e. barely 15,000 jobs month, a level which isn’t even sufficient to provide employment for new entrants to the labor force which ordinarily averages at least 100,000 every month. —Trump’s 2026 SOTU Speech: Economic Obfuscation and Political Theater
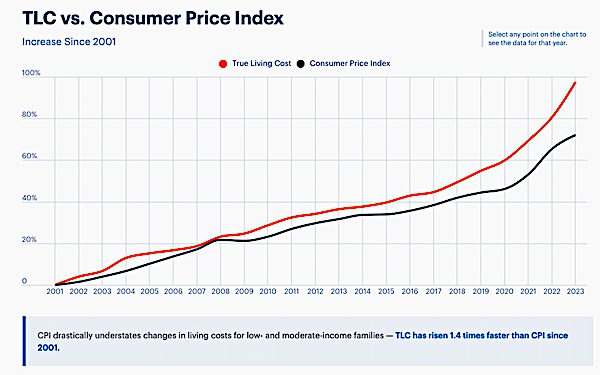
Ludwig Institute Latest Economic Indicators Living Costs vs. Consumer Price Index

Rate of Unemployment is 28.4%
The Living Costs Increase 9.4%
Median Earnings for a Full-TimeWorker Declined 5.1%
Real State State of the Union, The 1% are Getting Richer and Bottom 80% are Getting Poorer!: Reduce Inequality to Address AffordabilityIn the United States today, the cliché is true: The richer are getting richer and the poor are getting poorer. The saying has to be revised somewhat since it is the entire bottom 80 percent of households who are getting relatively poorer, not just households in poverty. Looking at these data, it is not surprising that US households are feeling squeezed. If most households are receiving a smaller share of all income than they did in the past, then this situation could easily generate economic anxiety and cause some goods to be more difficult to afford. There are several things that policymakers could do to reverse the increasing inequality and make things more affordable for low- and middle-income households. One is to increase the wages of low-wage workers by increasing the minimum wage. This would prevent the lowest quintile from experiencing continued declines in their share of income. Making it easier for workers to form unions pushes the wages of average workers up and reduces inequality. Other policies that support tight labor markets also help to increase wages and reduce inequality. In recent decades, the richest households have received even larger slices of all national income. Since they have had the strongest income growth, they should be also paying more in taxes to support public goods like schools, roads, health care, and so on. Instead, since the 1970s policymakers have been lowering taxes on the rich. More than 70 percent of the tax cuts in Trump’s 2025 Big Bill for Billionaires* goes to the richest fifth of US households. This is the opposite of what should be done to address inequality and affordability. * The official name is The One Big Beautiful Bill Act.
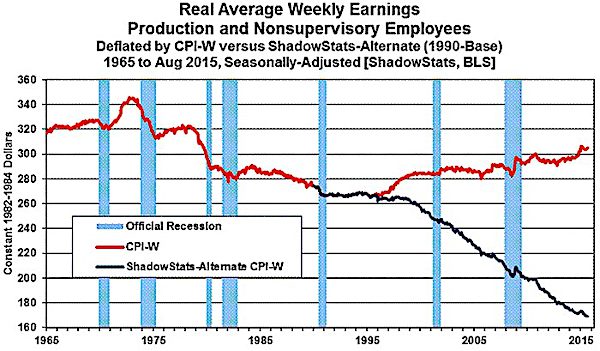
From My Essay The Condition of the United States Working Class — Where Do We Go From Here?(2018): At the same time, Real Wages have Fallen Since the Wage Price Freeze of 1972 (Shadow Government Statistics): Graph 3 plots the seasonally-adjusted earnings as officially deflated by the BLS (red-line), and as adjusted for the ShadowStats-Alternate CPI Measure, 1990-Base (blue-line). When inflation-depressing methodologies of the 1990s began to kick-in, the artificially-weakened CPI-W (also used in calculating Social Security cost-of-living adjustments) helped to prop up the reported real earnings. Official real earnings today still have not recovered their inflation-adjusted levels of the early-1970s, and, at best, have been in a minimal uptrend for the last two decades (albeit spiked recently by negative headline inflation). Deflated by the ShadowStats (1990-Based) measure, real earnings have been in fairly-regular decline for the last four decades, which is much closer to common experience than the pattern suggested by the CPI-W. See the Public Commentary on Inflation Measurement for further detail. This process has led to a greater productivity and windfall profits for the capitalist, without more value being added to society. The ‘Big Lie’ About Real Wages Has Been Going On For Decades:
Shadow Grovernment Statistics Graph: Real Average Weekly Earnings- Production and Nonsupervisory Employees